
Inventory can be one of the most costly things when it comes to running a bar or restaurant so analyzing your data to gain insights is one of the many benefits to using a reporting tool.
With pre-built reports on Backbar, you can quickly run reports and analyze your bar inventory without having to do complicated formulas on your own with spreadsheets. You can also share and export the reports and access them from any location for convenience.
The inventory and purchasing reports help pinpoint areas in your bar program that can be adjusted to lower liquor costs and increase profits, all while allowing you to stay on budget.
We'll go over each of the reports Backbar provides and why they are essential to running a successful beverage program.

Inventory Reports
Inventory reports provide with you summaries of inventory on drink types as well as locations. It also provides you with details of each item down to the location. By breaking down your inventory into different reports you can see where you are heavily investing your money and track month to month changes.
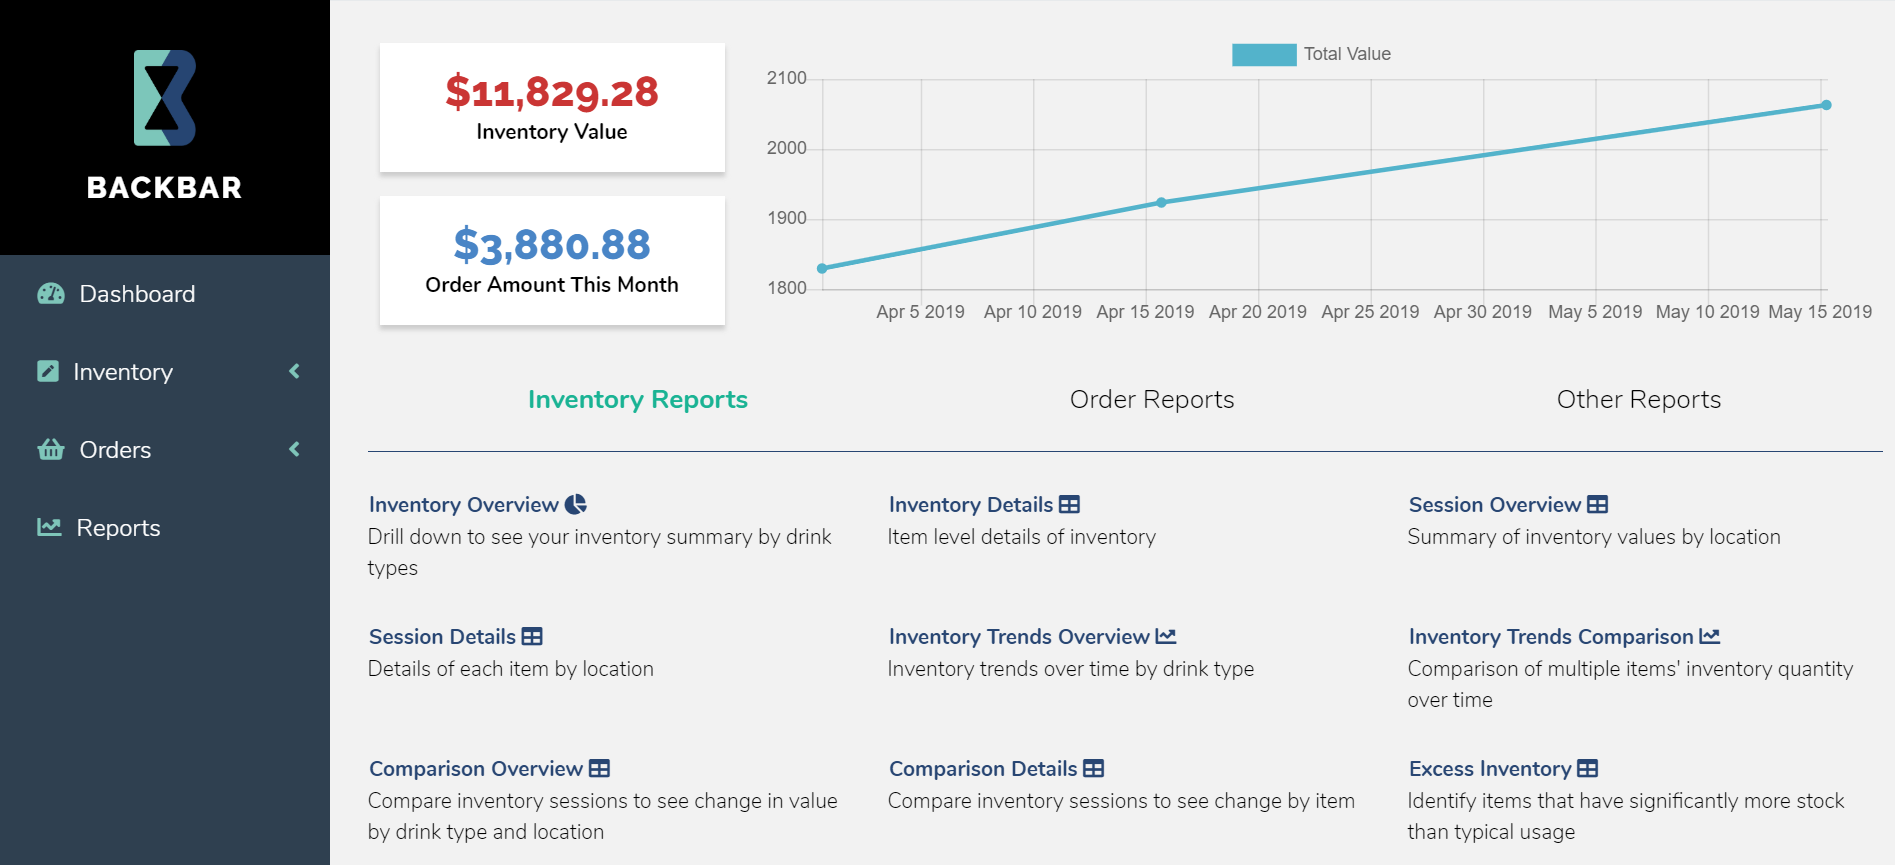
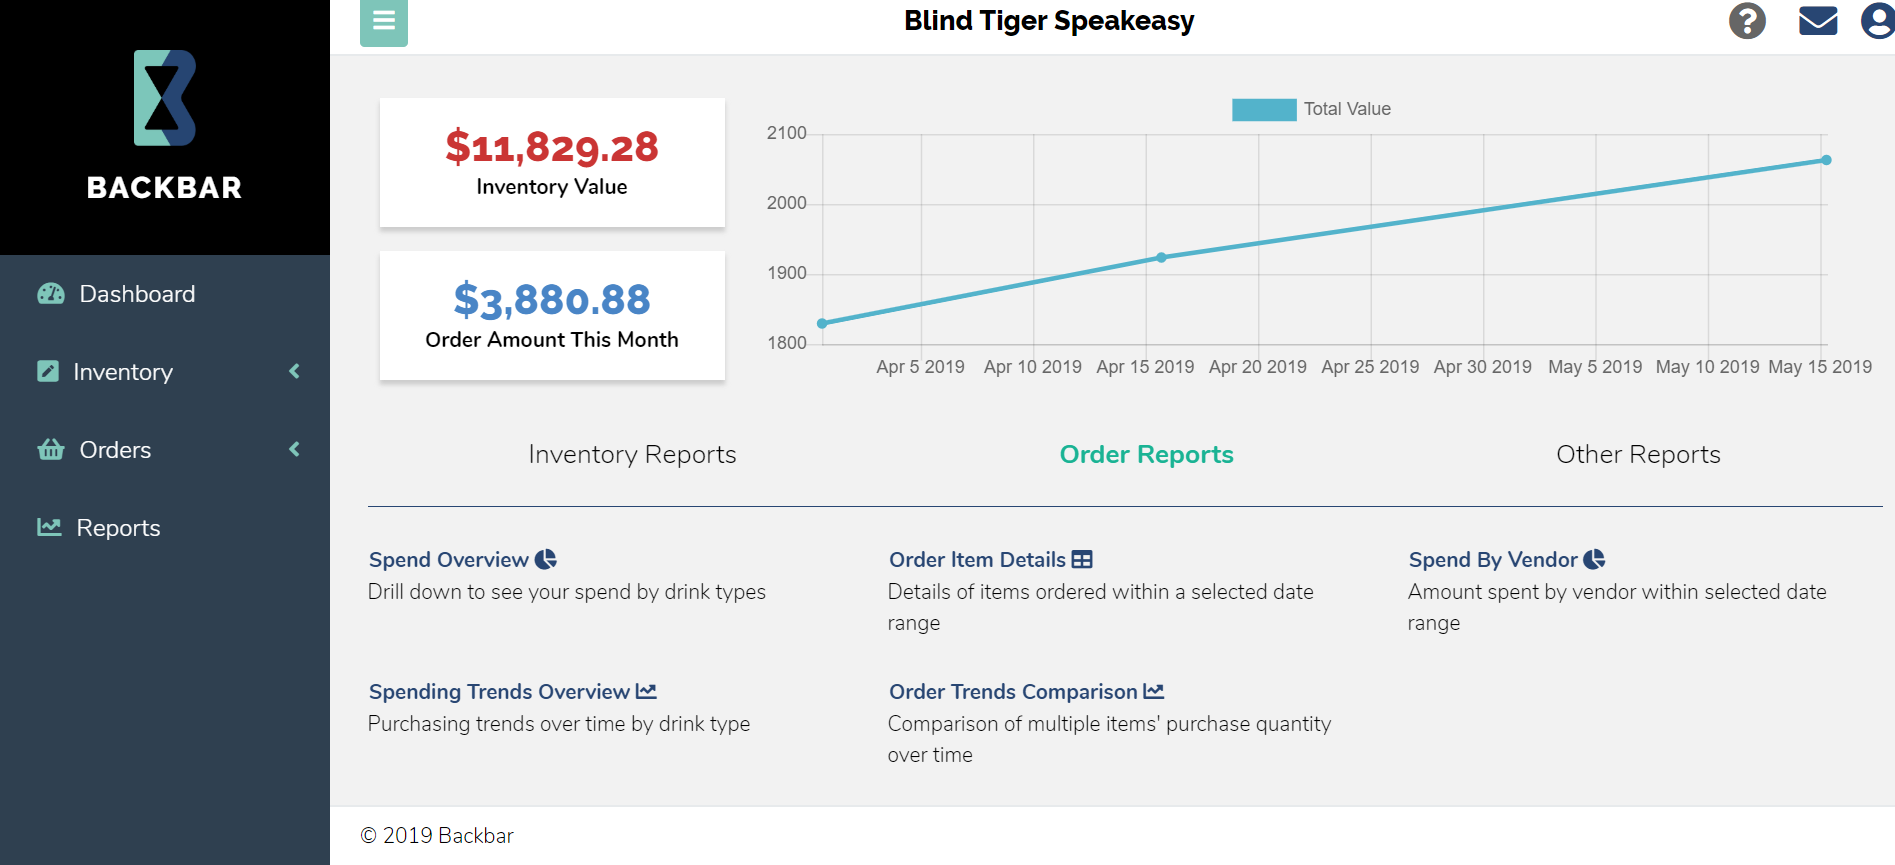
When you go into your reporting tools you will see a dashboard with different tools that looks like this and you can then choose a report to view.
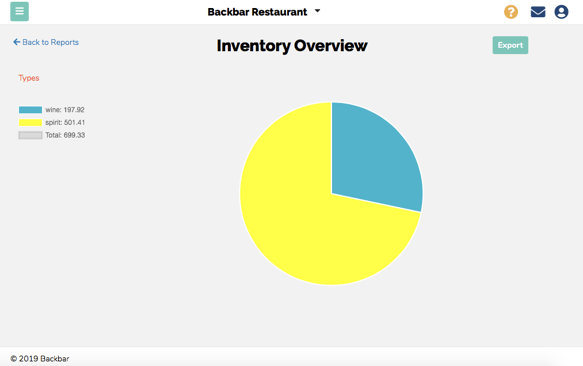
Inventory Overview
With the inventory overview report you can see your inventory summary by drink types (ie. wines, beers, spirits). This helps to show you what you have most of on hand and gives you an idea of where you are spending your budget. You can go one step further and under each category look at the subcategory.
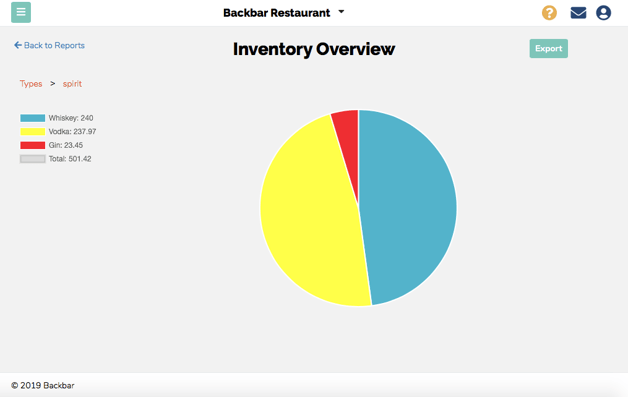
For example if you wanted to see how your spirits were divided it would then show you the summary based on the different types of spirits you have (e. gin, vodka, whiskey).
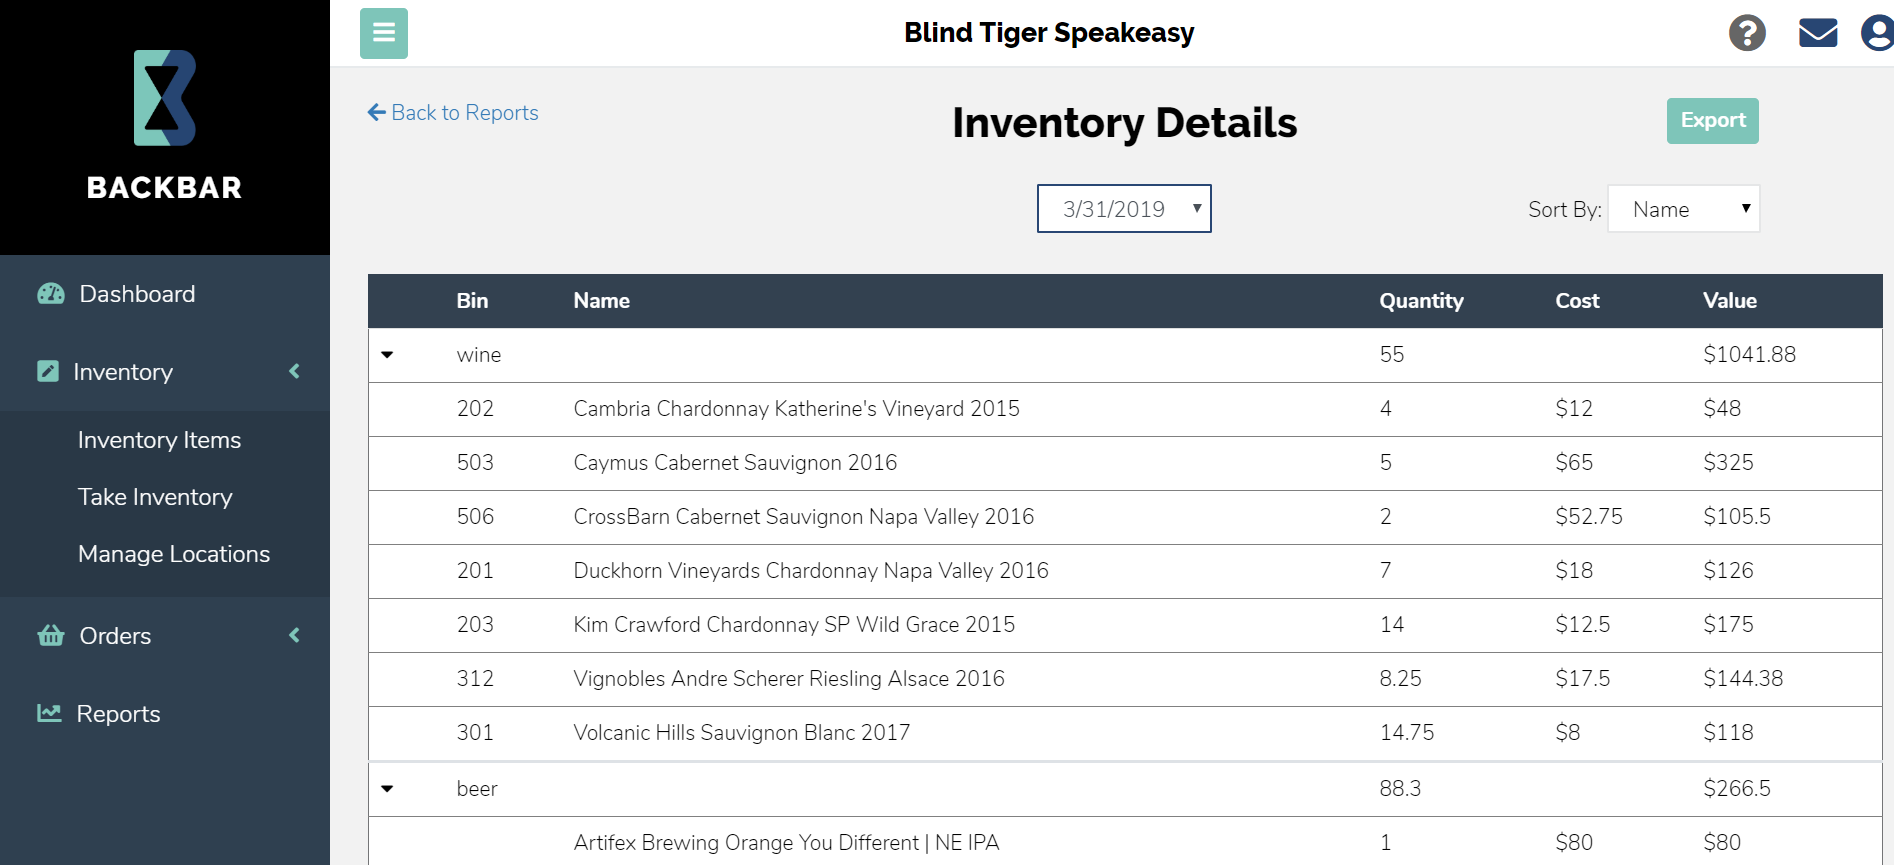
Inventory Details
The inventory details report provides item level details on the specific beers, wines and spirits on hand and quantity. You can also look back up to 6 months if you wanted to compare item details for different times of the year. It will also provide you with the cost so you can see the value you have on hand.
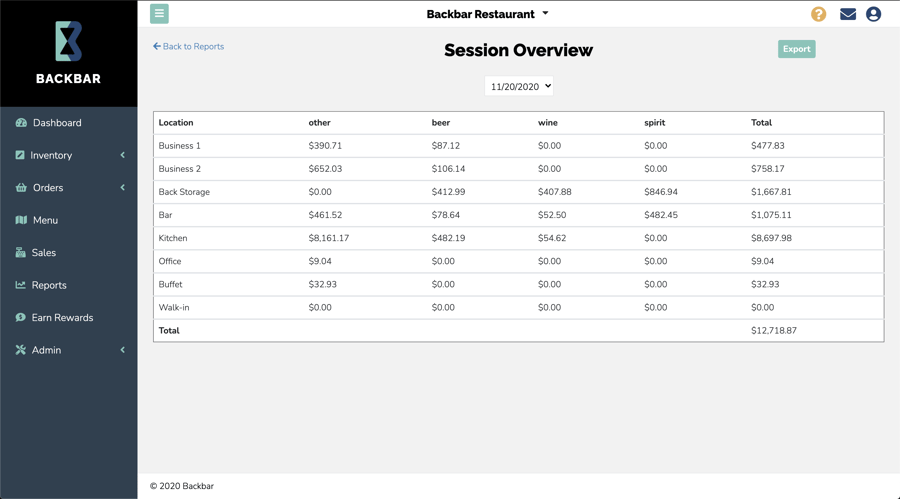
Session Overview
The session overview provides you with a summary of inventory values based on location. It subdivides them into the different locations you added into Backbar to give you a general idea of where most of your inventory is held. Again here you can also look at different dates in the drop down menu if you wanted to look back at previous dates inventory was taken.
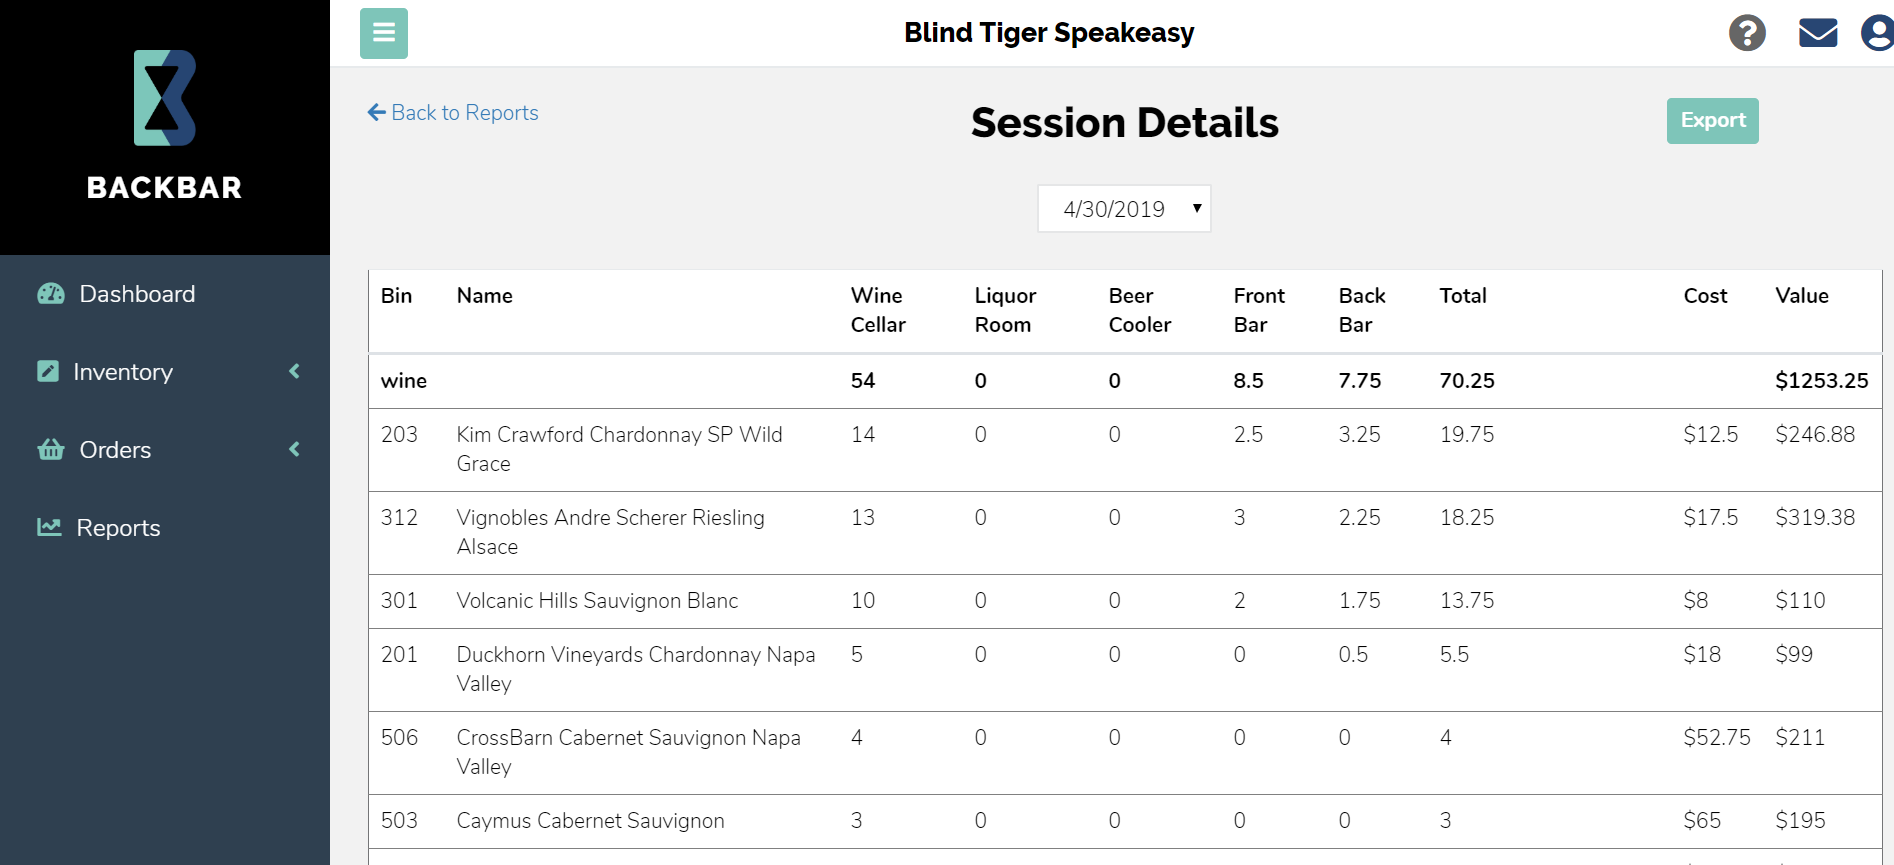
Session Details
The session details shows the details of each item based on location. You might hold a lot of one item in one location and less in another so this tool is helpful to see where these items flow through your bar.
Other Inventory Reports
Backbar also provides other inventory reporting tools to help you analyze your bar program to achieve your goals and help grow your bottom line.
Comparison Overview
Compare inventory sessions to see changes in value by drink type (ie. beer, wine, spirits) or location by selecting two different dates to compare.
Comparison Details
Compare inventory sessions to see change by specific items for two different chosen dates.
Inventory Trends Overview
This report shows you the inventory trends over time based on drink type. This gives you insights to see at what points in the year you hold more of something on hand than other times.
Maybe there is a certain time of the year you go through more wine, this overview will show spikes in inventory so you can anticipate future needs.
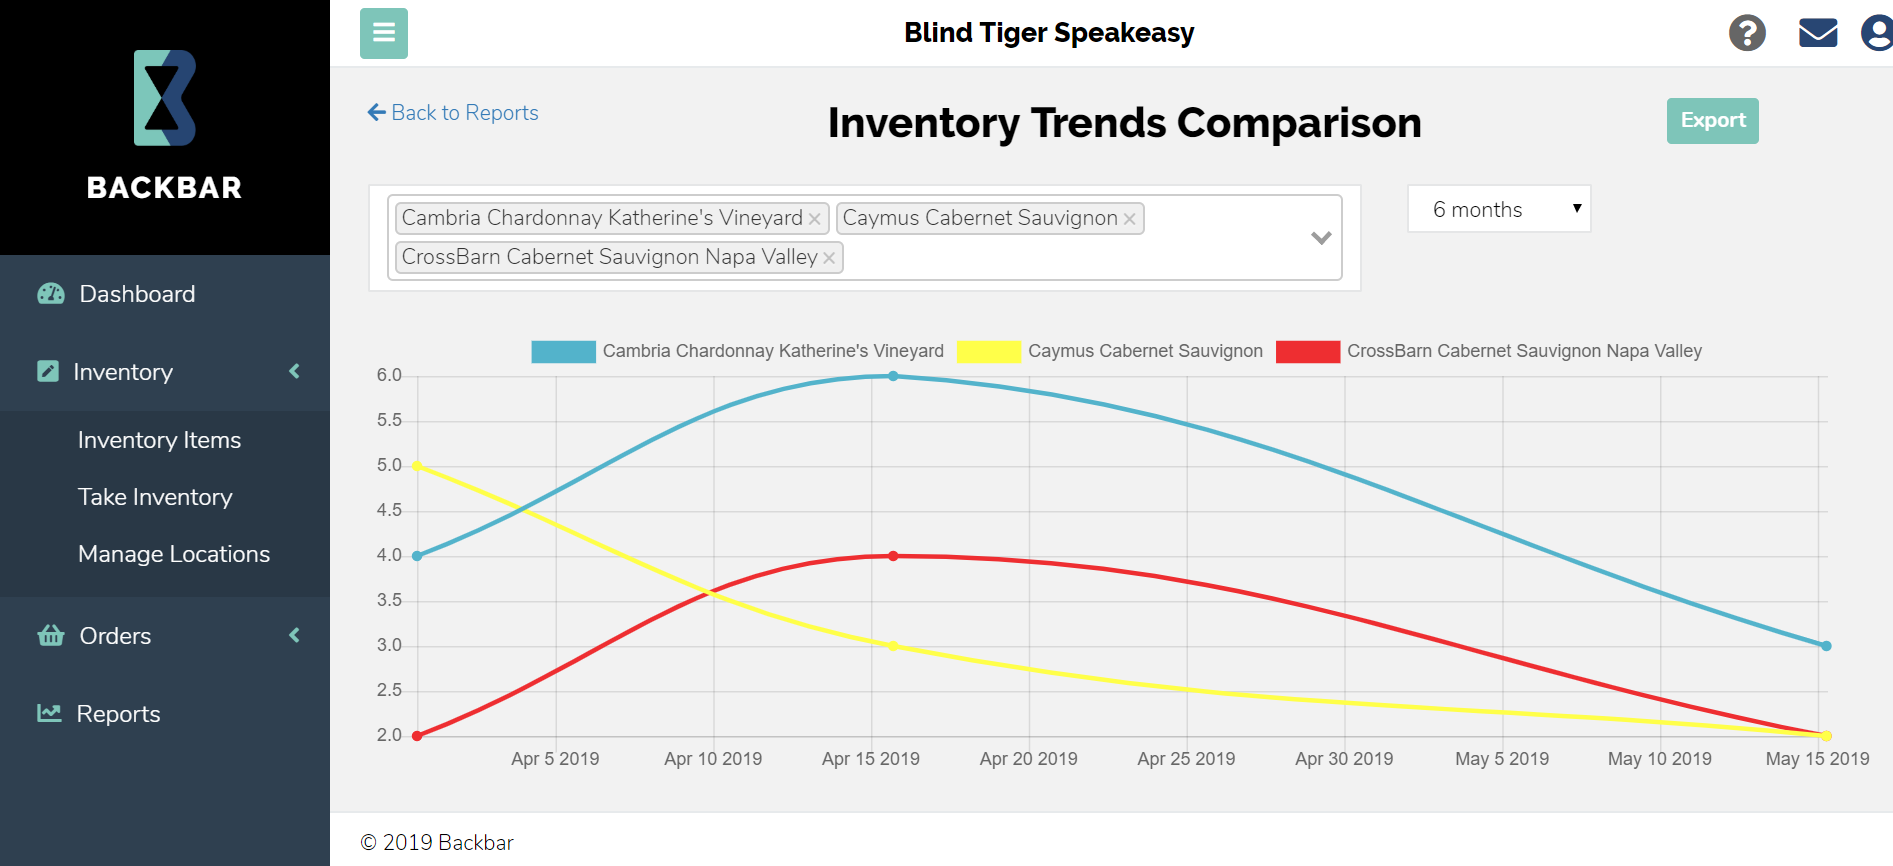
Inventory Trends Comparison
Here you can choose up to three different items to compare at once on the same chart. If you wanted to look at different wines you could look at specific items and it will show the trends for 6 months to all time.
Looking at these trends you can see when you sell more of a certain type of wine or maybe you have different brands for the same type of wine, you can compare and see which you have more of on hand so you know where you are spending.
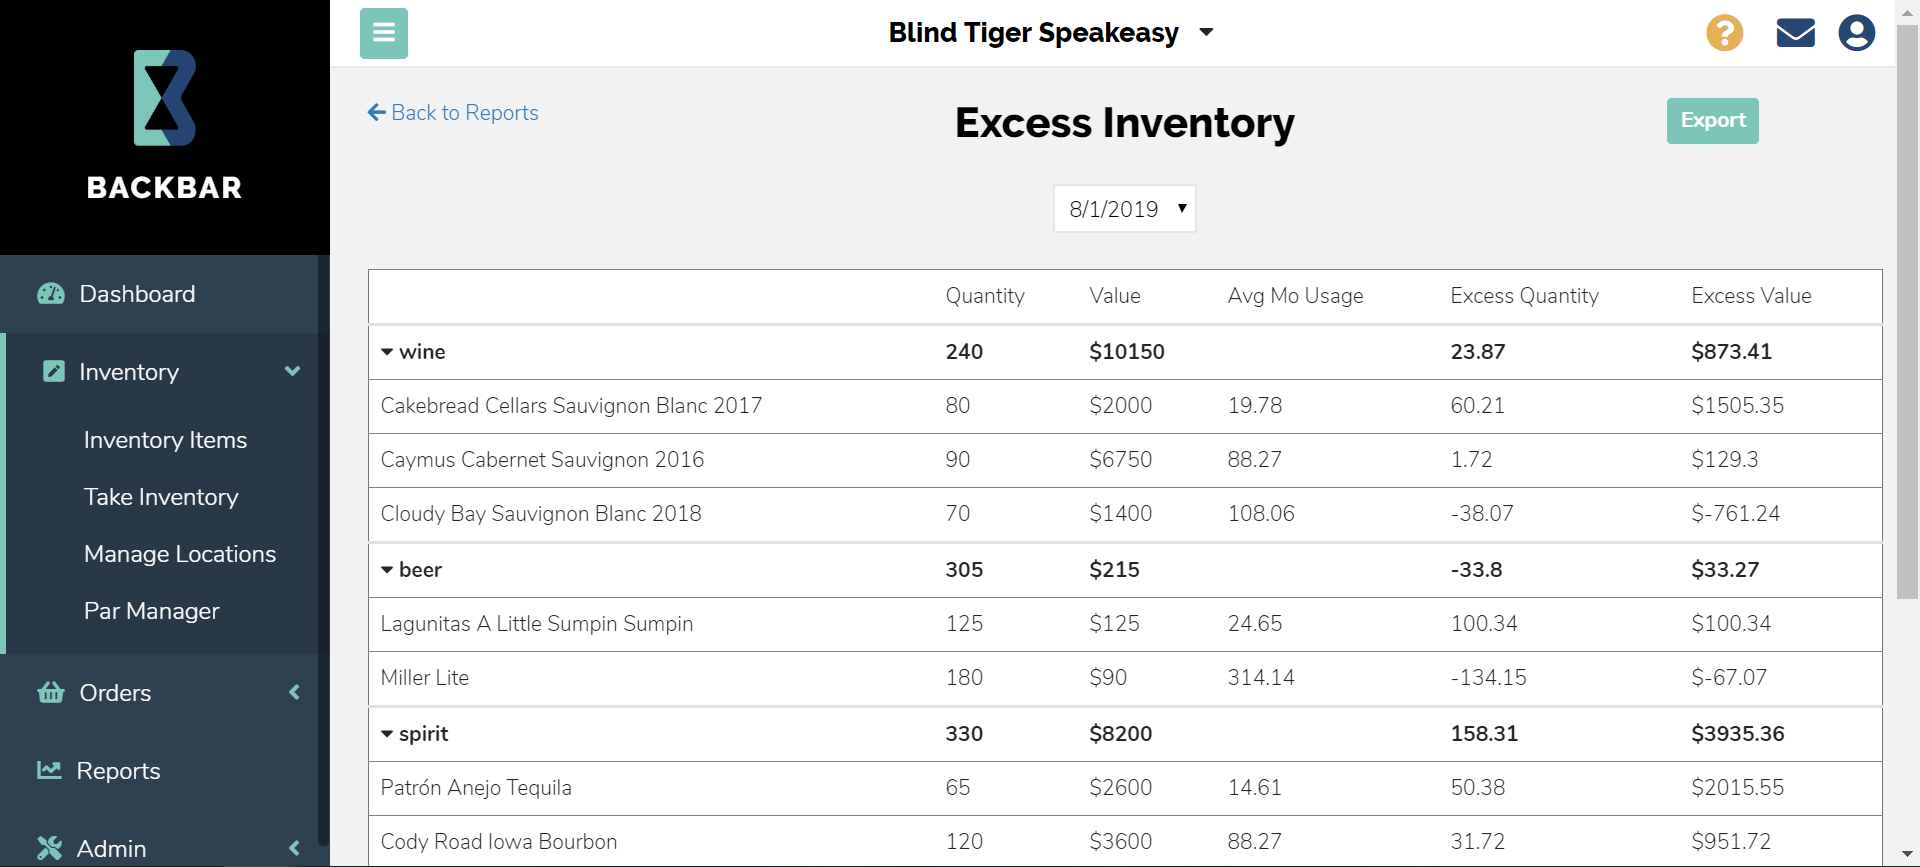
Excess Inventory
The excess inventory helps you prevent overstocking because it shows items that have significantly more stock than typical usage. If you have a significant amount of an item and wanted less on hand, you could run specials and deals for that item or put it on happy hour until you got your inventory down to an ideal amount.
Order Reports
The orders reports provides reports about orders you have received with vendors and where your budget is spent with general overviews and item details. The order reports dashboard will look similar to this.
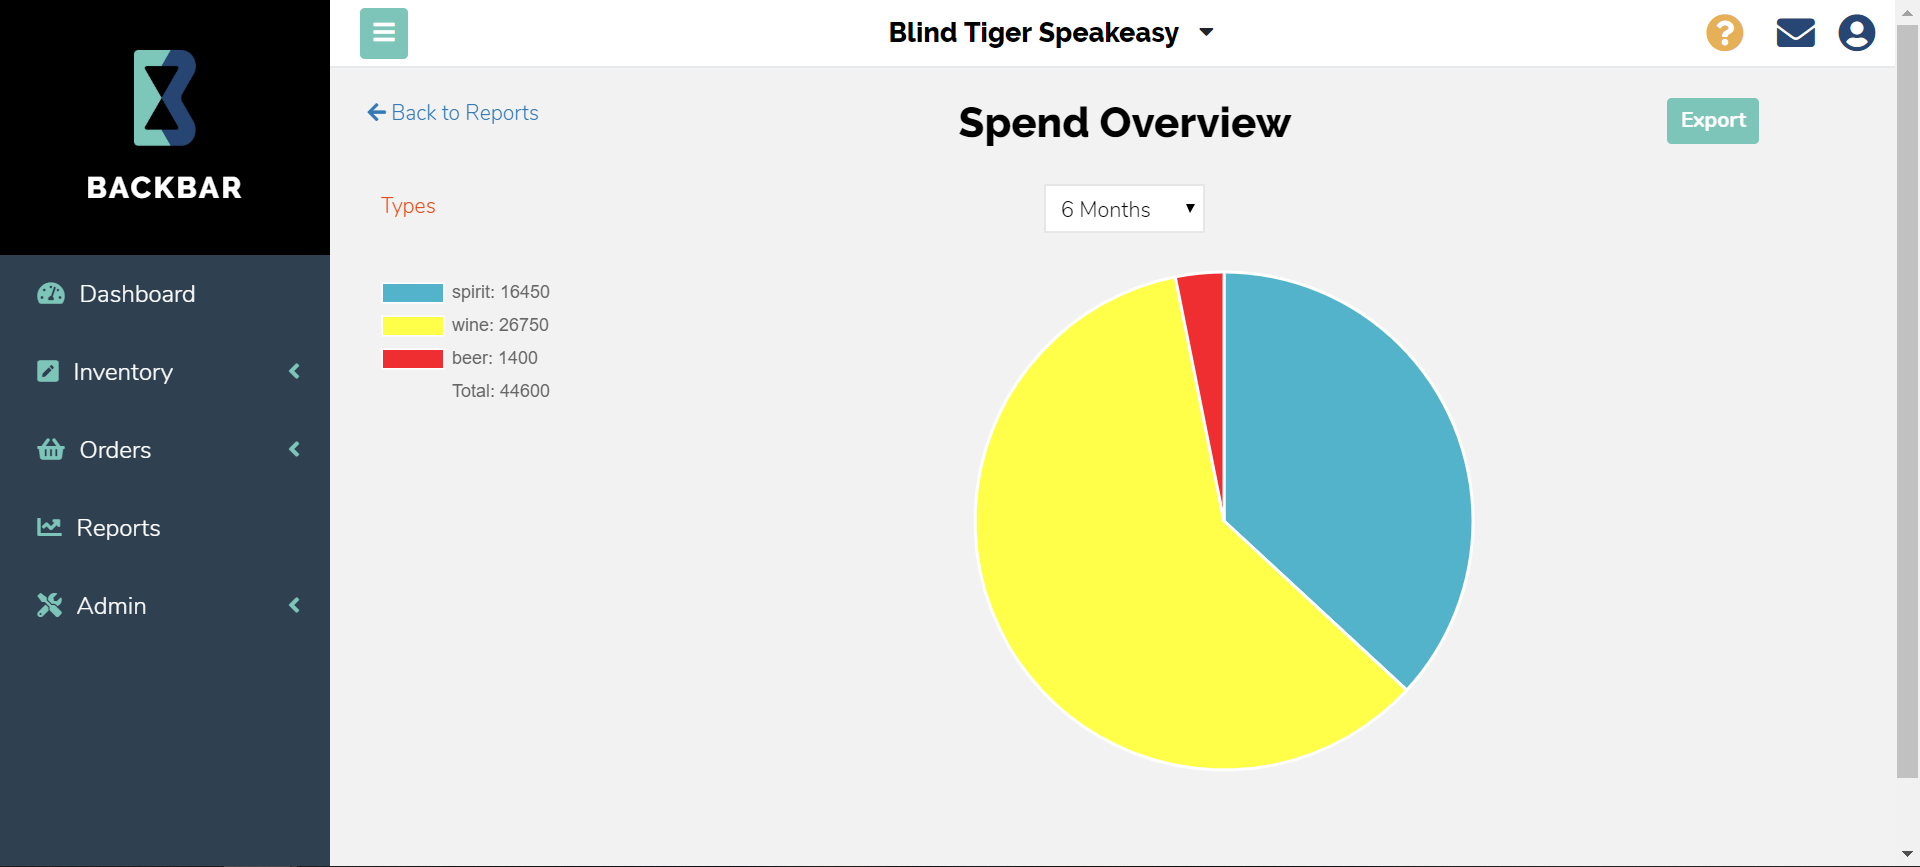
Spend Overview
Spend overview allows you to see how you are spending based on different drink types. You can also break it down to see the overview for the current month, last 6 months, 1 year, or all time. This is a quick way to check your spending habits and measure where you are investing.
Spend By Vendor
Here you can check the amount that is spent on each vendor within a selected date range. It is a quick overview to track any changes in your spending based on vendor.
Order Item Details
To see details of items ordered within a selected date range you can view the Order Items Details report. Here you can also sort by Name, Quantity, Cost, and Total Cost for the current month to all time.
Other Order Reports
In addition to the reports described above, Backbar provides you with even more order reporting tools that look at drink type trends over time and a comparison tool of previous orders.
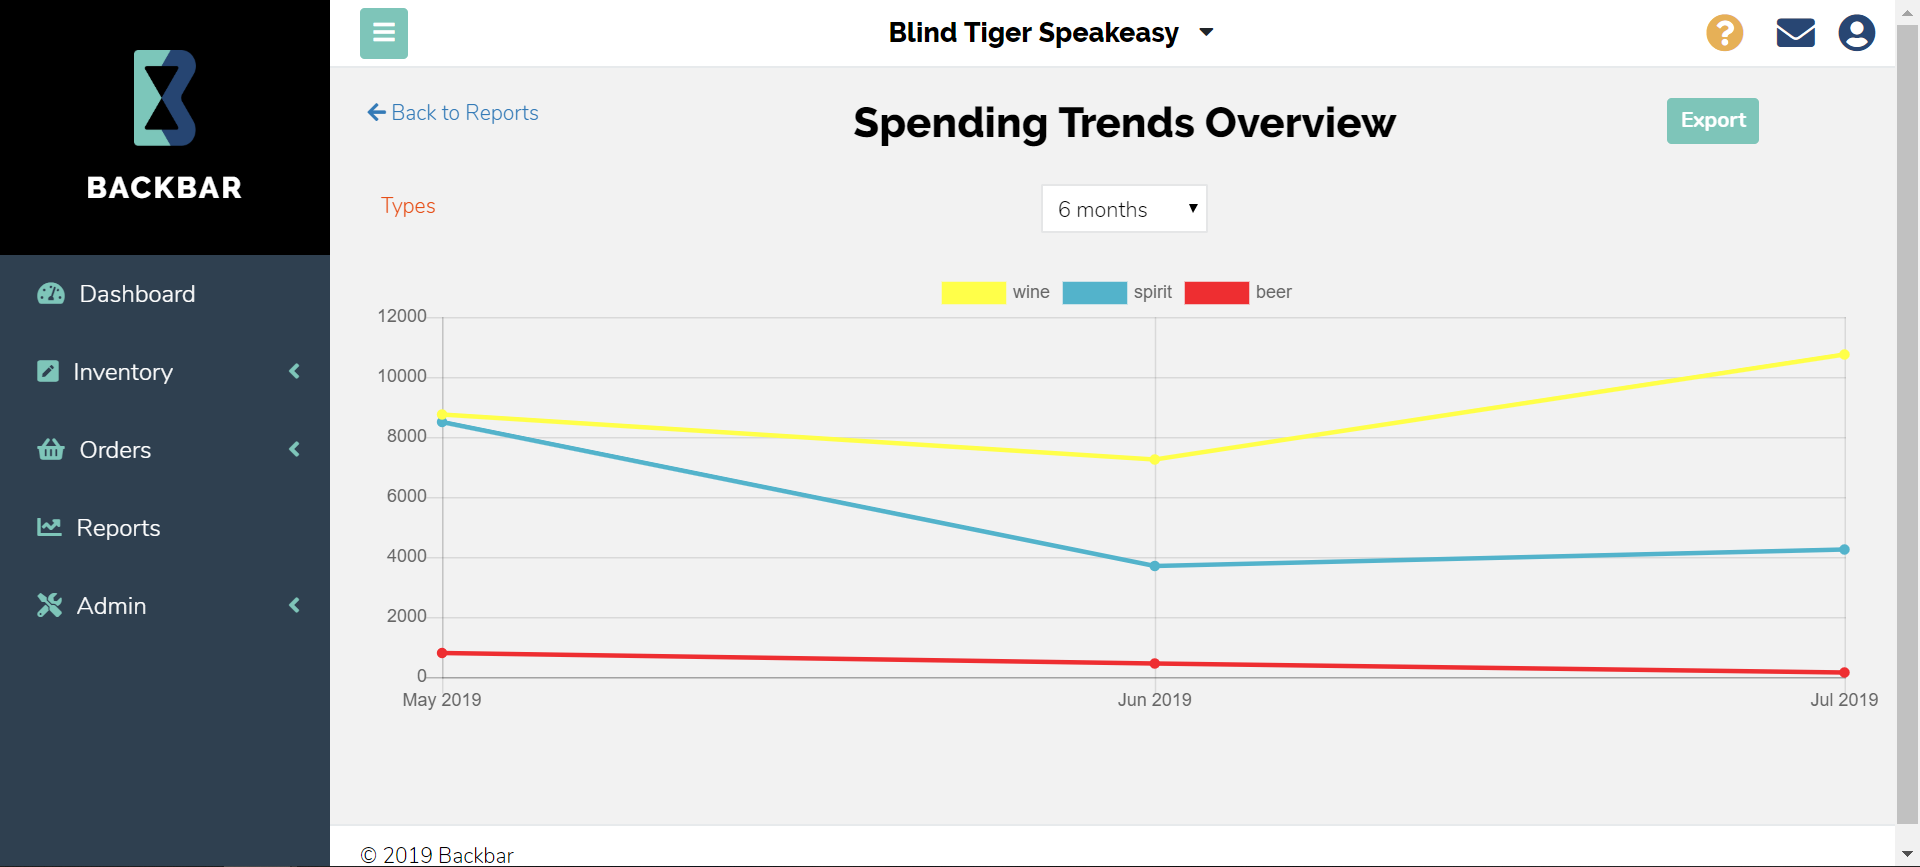
Spending Trends Overview
Another tool to help track purchasing is the Spending Trends Overview, which gives you insights to purchasing trends by drink type over time.
Looking at the spending trends not only shows you where you are spending your budget, but might give you insights to consumer purchasing trends. Maybe you have a spike in wine for the summer or winter months, you can anticipate that you might need to order more in those months to keep up with consumer demands.
Order Trends Comparison
Another way to track your purchases is the Order Trends Comparison tool that compares multiple items' purchase quantity over time. Again this shows trends of when certain items are being ordered through the year so you can see and drops or spikes.
Other Reports
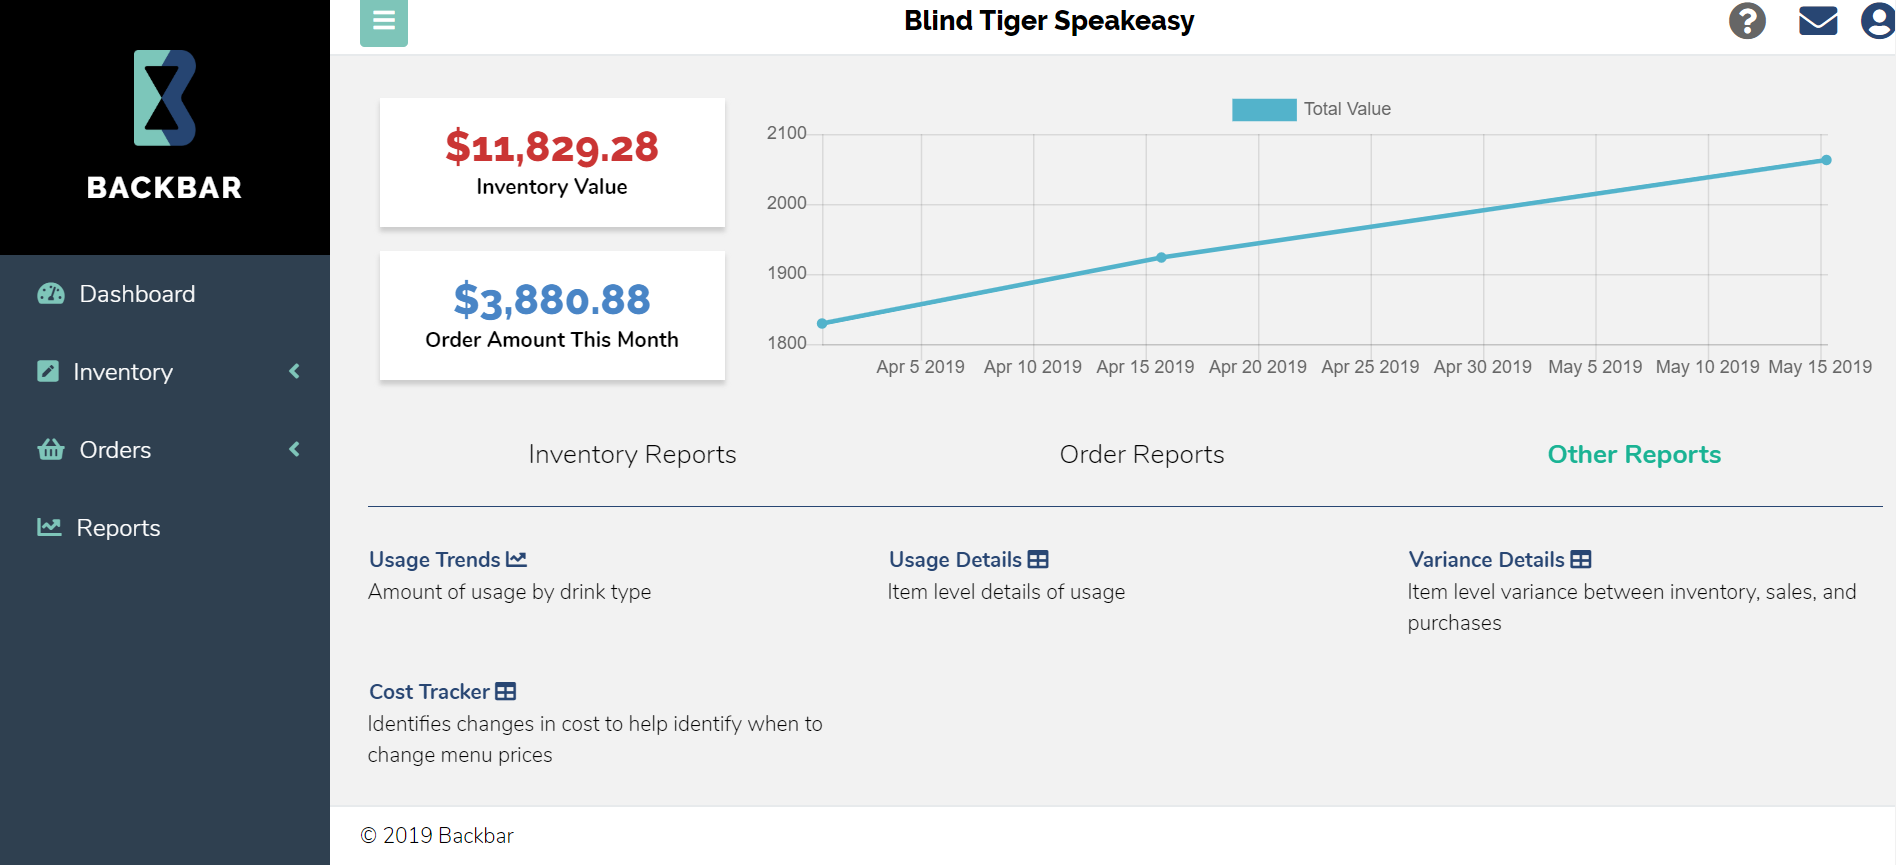
In addition to inventory and order reports, Backbar also provides users with additional reports to that include a combination of inventory and purchasing data. This is how your other reports dashboard will look.
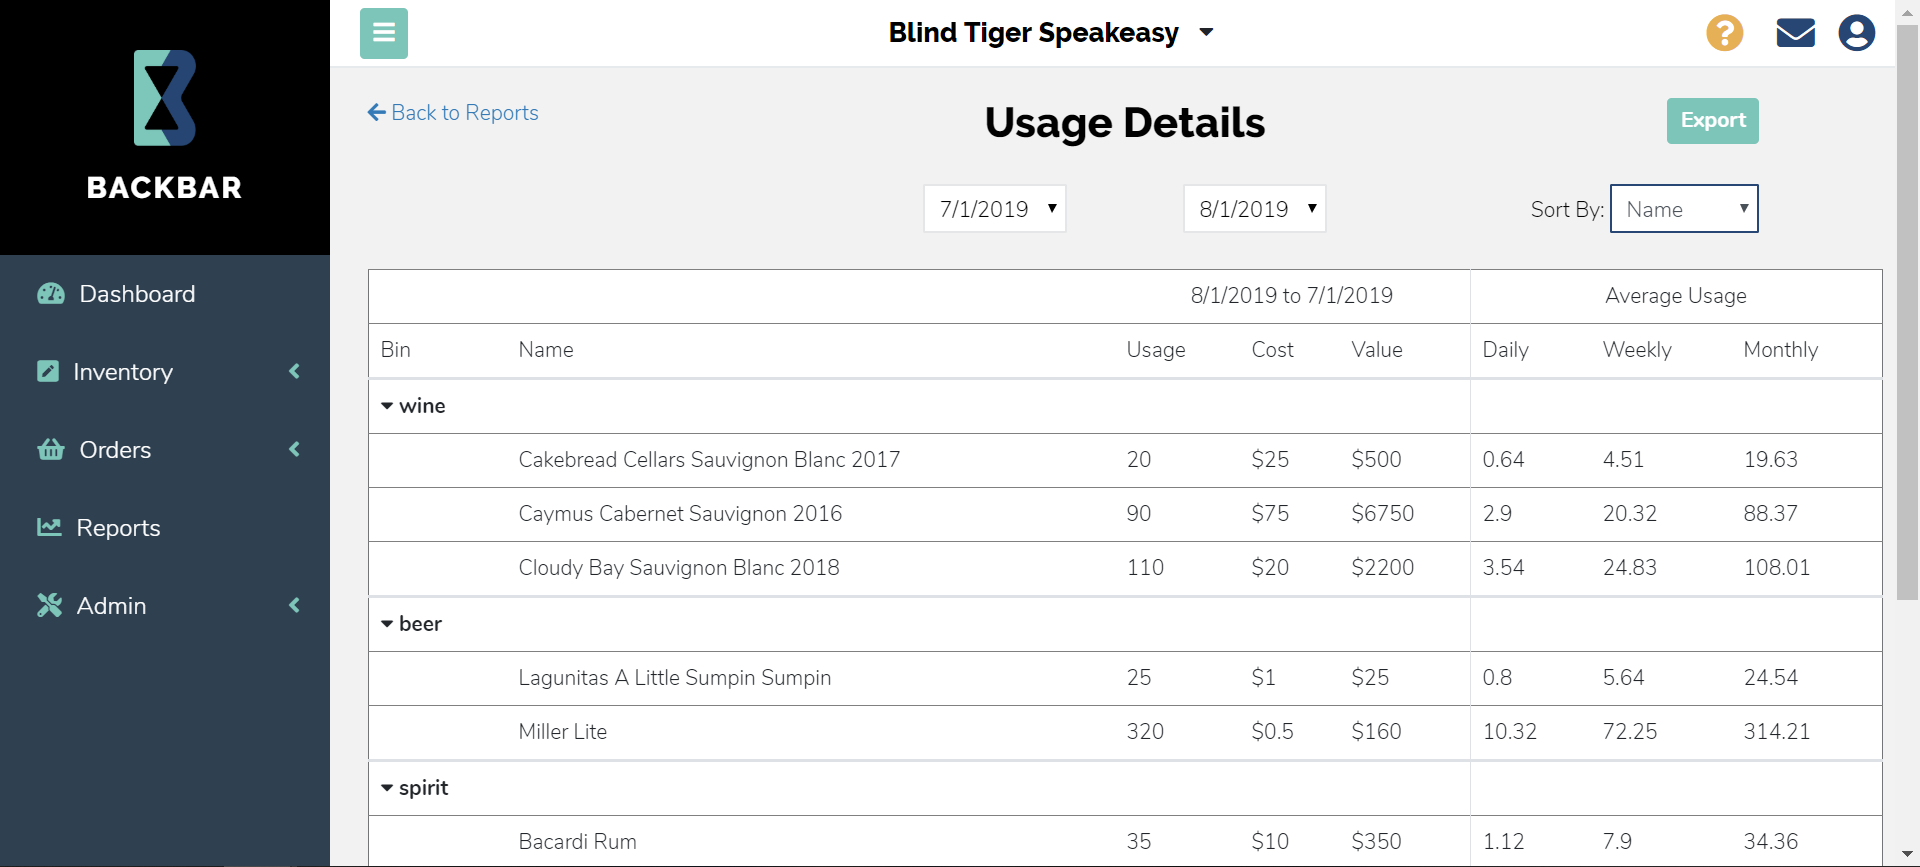
Usage Details
This provides users with a view of the daily, weekly and monthly usage of an item for a chosen period of time. This gives you a deeper look at how much product you are going through on average so you can keep enough inventory on hand and know how much to order to avoid overstocking.
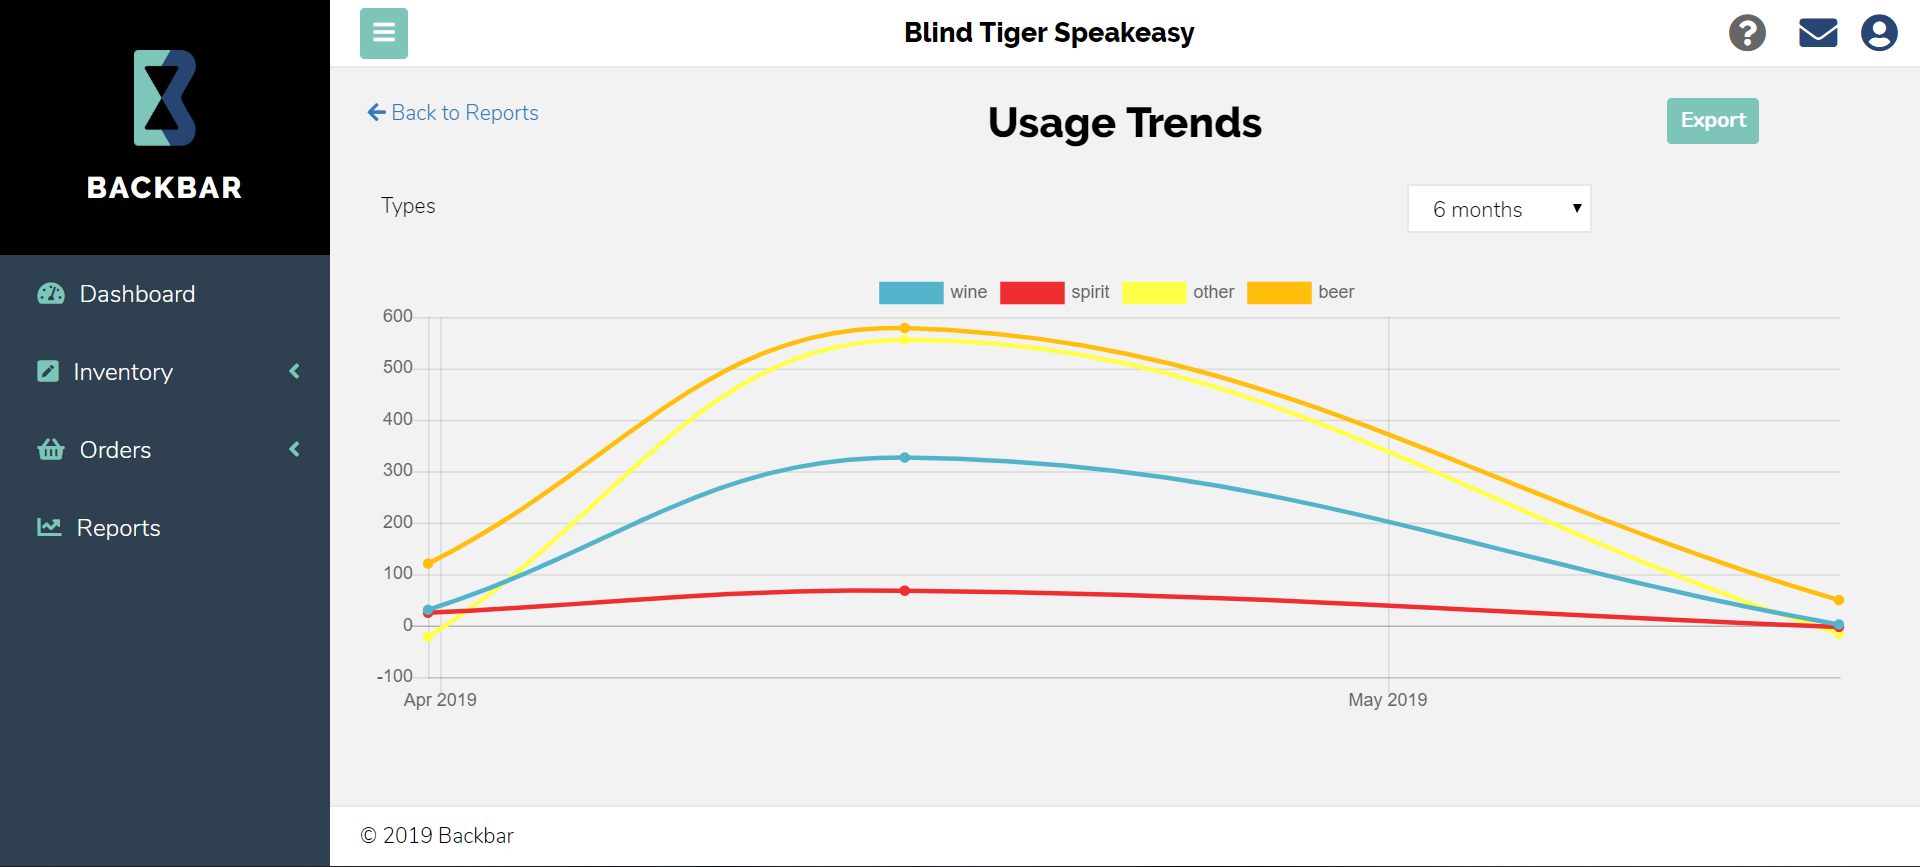
Usage Trends
If you want to see the amount of use by drink type rather than a specific item, you can view the Usage Trends report. This shows peaks and lows of usage so you can see if any patterns develop.
To effectively use the Usage Reports, Backbar needs to know the inventory counts at two different dates and how much of the item was ordered.
Starting Inventory + Quantity Purchased - Ending Inventory = Usage Quantity
Cost Tracker
In order to stay profitable, restaurants need to know how and when to change prices. The Cost Tracker report shows if there are any changes in cost for any of your items from your vendors. With this information you can adjust prices you charge in order to remain profitable. If you notice you are spending more than your budget, you can go back and see if any of the products you order have increased their prices. This tool helps to keep you on track with your budget and can help pinpoint where changes might be coming from.


